Results tab
The results table displays annotations for chains and chain pairs which match the search criteria or have been uploaded, together with associated data annotations.
The results are presented in three sections, heavy and light (where the sequence numbering is given), and combined (representing all data for paired chains). Each section consists of two views, the sequence alignment view and the data table view. All six views can be hidden by clicking on the respective title bar.
If there are more than 20 results, the table will be split into pages and navigation buttons will appear above the table. Use the paging buttons to go forward or back one page. Use the button to go back to the first page. The number of results per page can be adjusted using the dropdown.
Alignment view
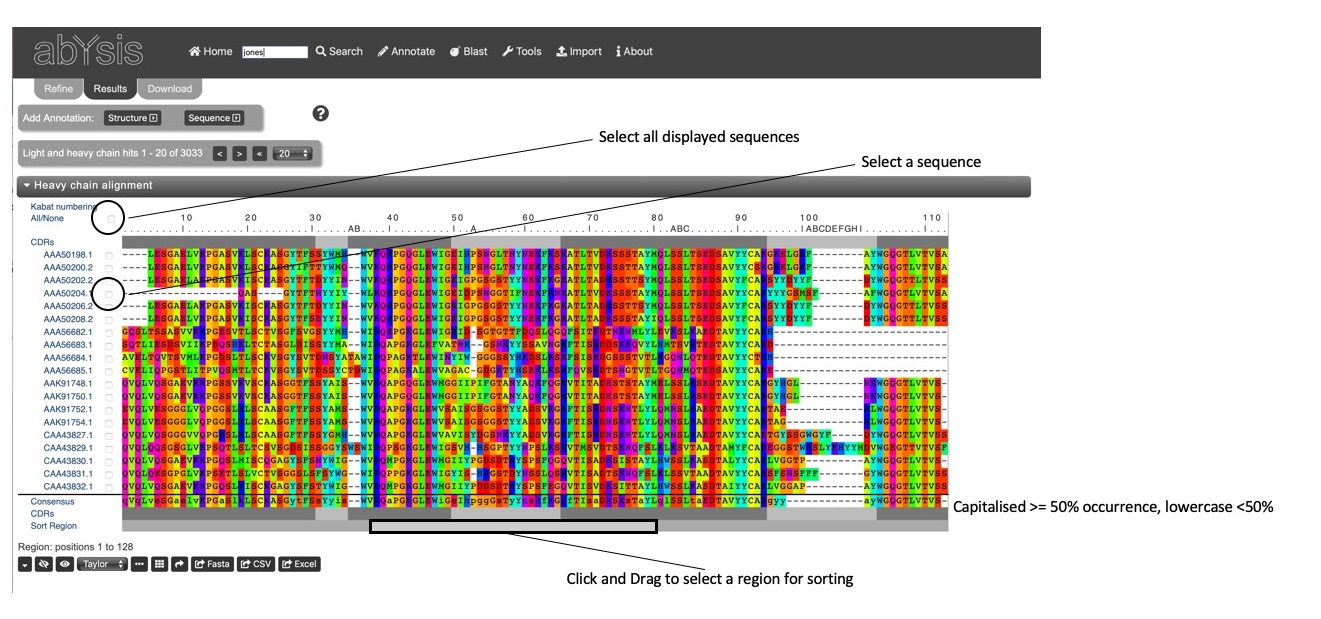
The alignment view shows numbered antibody sequences with a key (.........|.........) at the top of the alignment. Hovering over the key will show the residue number.
Below the key and at the bottom of the alignment is a bar indicating the frameworks (dark grey) and CDRs (light grey) using the Kabat definitions of the regions. (See the help on About / Definitions page for information of region definitions.)
A Consensus sequence is shown at the bottom of the alignment. The consenseus residue is shown in upper case if that residue type is found in greater than 50% of displayed sequences otherwise the residue is in lower case.
Control Buttons
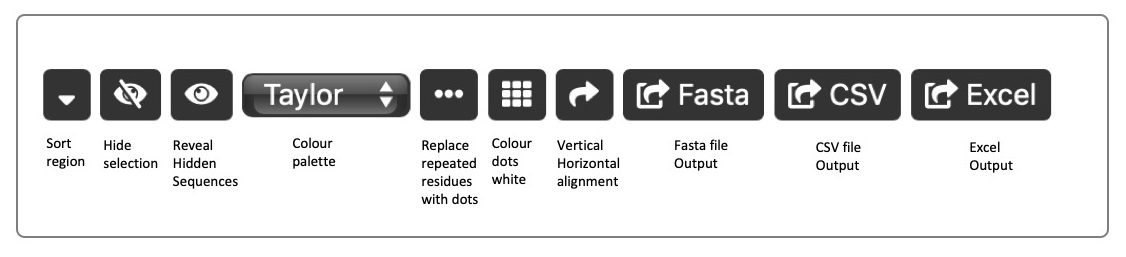
Sorting Sequences can be sorted based on sequence similarity using the Sort button. A representative sequences (most similar on average to the other sequences) is selected and placed at the top of the alignment, with the other sequences shown in groups gradually changing from the representative. By default, sorting is performed over the whole sequence, but the region over which the sort is displayed can be changed using the Sort Region. This, for example, might allow a sort to be performed over a particular CDR. Right-click at the start of the region you wish to base the sort on, and again at the end of the sort region. The sort region will turn grey. Now click the Sort button. Note that a sort operation will also re-order the associated data table.
Colours A selection of amino acid colour schemes is available using the colour dropdown. The Dotify checkbox causes residues the same as the residue above in the alignment to be represented by a dot. The Nocolour checkboxes removes the colouring of those residues. This enables one to focus on differences in the sequences.
Hiding sequences Sequences can be selected by checking the box next to each sequence identifier. Once a set of sequences is selected, click the Hide button. to hide the sequence(s). All hidden sequences can be re-displayed using the Unhide button. Note that hidden sequences will also be hidden in the associated data table.
Transpose view The sequences can be re-oriented to allow a vertical view by toggling the Transpose view button. Note that sorting by sort region is not included in this view.
Exporting sequences The aligned sequences can be exported in FASTA format. Select the sequences to be exported (selecting no sequences is the same as selecting them all) and click the Export button. A dialogue will be displayed showing the sequences in FASTA format and these can then be cut-and-pasted into another application.
You can also export data and sequences to CSV (comma-separated values) format and Excel XML format. Your MS Excel version must be capable of supporting XML. Data and sequences will be exported for the unhidden items only
Data table view
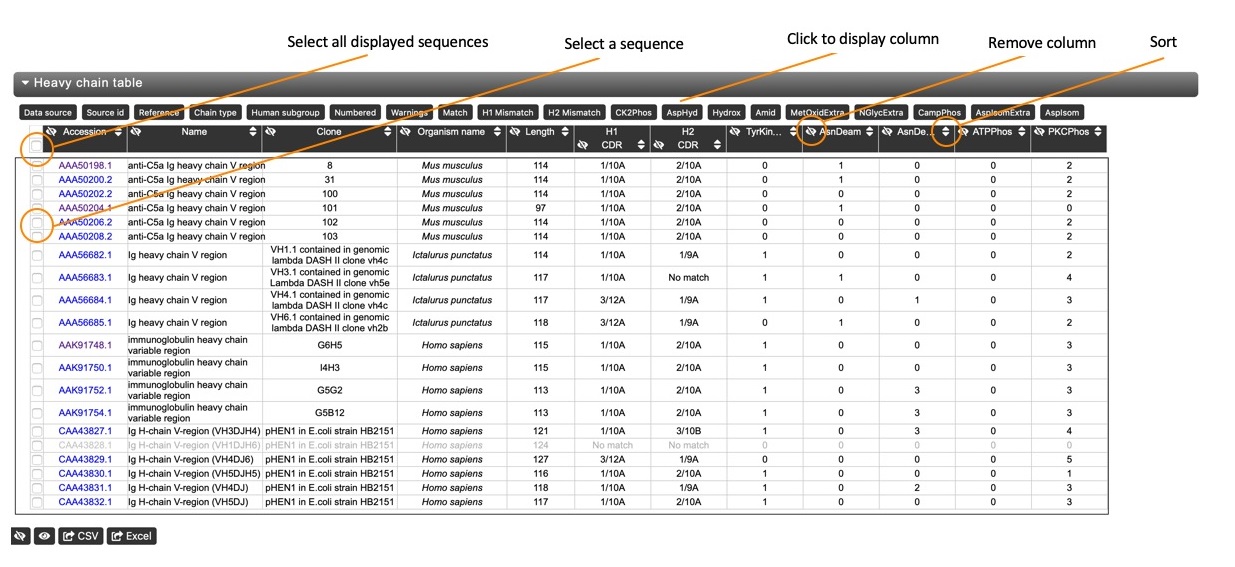
The data table view provides a brief summary of key features and annotations of the sequences, allowing a quick comparison. A set of default columns (Accession Number, Name, Clone, Organism Name and Length) is displayed, but other basic columns can be added by clicking the respective button in the 'Show Hidden Columns' list. These include CDR assignments and phosphorylation, hydroxylation, glycosylation and amidation sites.
Hiding columns Columns of the table can be hidden (added to the 'Show Hidden Columns' list) by clicking the respective hide button in the column header.
Sorting The table can be sorted (and reverse sorted) by any column. Click on the respective sort button in the column header to sort the column, and click again to reverse sort the column. Note that the sequence alignment view will also be re-rodered based on the sort.
Customizing the View
To further annotate the data table, click the or button next to 'Add Annotation'.
This will open up the annotation options section. To apply the changes to the table click at the bottom of the display options section or reset to the defaults by clicking the button.
Results are cached making it relatively quick to add extra columns to the display or to page through the results, once they have been obtained. Very large results sets are not cached.
Structure Detail
The Structure Detail section is used to display annotations corresponding to the Structure search criteria in the query form.
- Canonical Classes - you select the CDRs and canonical definition method to use. (See the help on the About / Definitions page for information on canonical definitions.)
- Environment of selected positions for results with known structures For the selected chain, shows any specified residues within a given distance in known structures. For example, show all tryptophan (W) and tyrosine (Y) that have a closest atom within 6.0Å of L32 in light chains.
- Environment of selected positions using distance distributions For the selected chain, shows any specified residues within a given distance in known structures and in sequences using predicted distances. For example, show all light chain residues that have a C-alpha to C-alpha distance of ≤6.0Å from L32.
Sequence Detail
The Sequence Detail section is used to display annotations corresponding to the Sequence search criteria in the query form.
- Region sequences and/or lengths. Specify the Region Definition (Chothia, Kabat, AbM or Contact) and check the boxes of what you want to display - Sequence and/or Length for each of the regions. For example, you could add a column showing the sequence for the Kabat CDR-L3 region in each hit.
- Amino Acids as selected positions. Specify the Chain, Numbering Scheme and the residue Position using that scheme to display a column showing the residue present at the selected position. For example, show the residue position at Kabat position H23 for heavy chains.